Barnes Surface
The Barnes Surface rendering transformation is a Vector-to-Raster transformation which computes a interpolated surface across a set of irregular observation points. It is commonly used as an interpolation technique for weather maps and other meteorological datasets. The surface is generated dynamically from the dataset, so it can be used to visualize changing data. The surface view is created by configuring a layer with an SLD style which invokes the Barnes Surface rendering transformation.
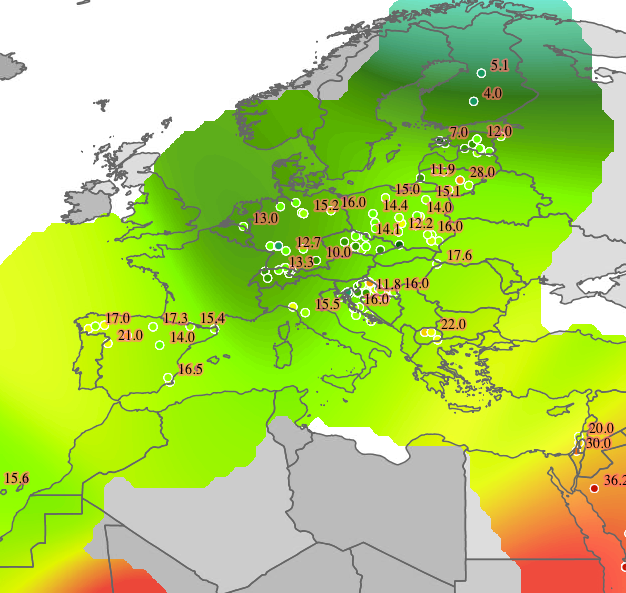
Barnes Surface rendering transformation used to render a maximum temperature surface
Description
The Barnes Surface algorithm operates on a regular grid of cells covering a specified extent in the input data space. It computes an initial pass to produce an interpolated value for each grid cell. The value of a cell is determined by its proximity to the input observation points, using a summation of exponential (Gaussian) decay functions for each observation point. Refinement passes may be used to improve the estimate, by reducing the error between the computed surface and the observations.
The rendering transformation uses the Barnes Surface algorithm to compute a surface over a set of irregular data points, providing a raster surface as output. The input is a dataset of points, with an attribute providing an observed value for each point. The radius of influence of each observation point is controlled by the length scale. A number of refinement passes can be performed to improve the surface estimate, with the degree of refinement controlled by the convergence factor.
Usage
As with all rendering transformations, the transformation is invoked by adding a <Transformation> element to a <FeatureTypeStyle> in an SLD style. The SLD can then be applied to any layer which is backed by a suitable dataset (featuretype). The SLD can be applied to any layer which is backed by a suitable dataset (featuretype).
The transformation is specified with a <ogc:Function name="gs:BarnesSurface"> element, with arguments which supply the transformation parameters. The arguments are specified using the special function <ogc:Function name='parameter'>. Each function has as arguments:
- an <ogc:Literal> giving the name of the parameter
- one or more literals containing the value(s) of the parameter.
The transformation parameters are as follows. The order of parameters is not significant.
| Name | Required? | Description |
|---|---|---|
| data | Yes | Input FeatureCollection containing the features to map. |
| valueAttr | Yes | Name of the value attribute. |
| dataLimit | No | Limits the number of input points which are processed. |
| scale | Yes | Length Scale for the interpolation. In units of the input data CRS. |
| convergence | No | Convergence factor for refinement. Between 0 and 1 (values below 0.4 are safest). (Default = 0.3) |
| passes | No | Number of passes to compute. Value can be 1 or greater. (Default = 2) |
| minObservations | No | Minimum number of observations required to support a grid cell. (Default = 2) |
| maxObservationDistance | No | Maximum distance to an observation for it to support a grid cell. 0 means all observations are used. In units of the input data CRS. (Default = 0) |
| noDataValue | No | The NO_DATA value to use for unsupported grid cells in the output. |
| pixelsPerCell | No | Resolution of the computed grid. Larger values improve performance, but may degrade appearance if too large. (Default = 1) |
| queryBuffer | No | Distance to expand the query envelope by. Larger values provide a more stable surface. In units of the input data CRS. (Default = 0) |
| outputBBOX | Yes | Georeferenced bounding box of the output |
| outputWidth | Yes | Output image width |
| outputHeight | Yes | Output image height |
The transformation has required parameters which specify the input data extent and the output image dimensions. The values of these parameters are obtained from environment variables accessed via the function <ogc:Function name="env">. The environment variable values are determined from the WMS request which initiated the rendering process. The parameters and corresponding environment variables are:
- outputBBOX uses variable wms_bbox to obtain the surface extent
- outputWidth uses variable wms_width to obtain the output raster width
- outputHeight uses variable wms_height to obtain the output raster height
Input
The Barnes Surface rendering transformation is applied to a vector input dataset containing features with point geometry. The dataset is supplied in the data parameter. The observation value for features is supplied in the attribute named in the valueAttr parameter.
To prevent extrapolation into areas unsupported by observations the influence of observation points can be limited using the minObservations and maxObservationDistance parameters. This also increases performance by reducing the observations evaluated for each grid cell. Uncomputed grid cells are given the value noDataValue.
To ensure the computed surface is stable under panning and zooming the extent for the input data can be expanded by a user-specified distance (queryBuffer). This ensures enough data points are included to avoid edge effects on the computed surface. The expansion distance depends on the length scale, convergence factor, and data spacing in a complex way, so must be manually determined (a good heuristic is to set the distance at least as large as the length scale.)
To prevent excessive CPU consumption the number of data points processed can be limited using the dataLimit parameter. If the limit is exceeded an output is still produced using the maximum number of points.
To improve performance the surface grid can be computed at lower resolution than the output raster, using the pixelsPerCell parameter. The computed grid is upsampled to the output raster size using Bilinear Interpolation with Edge Smoothing to maintain quality. There is minimal impact on appearance for small cell sizes (10 pixels or less).
The surface is computed in the CRS (coordinate reference system) of the output. If the output CRS is different to the input CRS the data points are transformed into the output CRS. Likewise, the distance-based parameters scale and maxObservationDistance are converted into the units of the output CRS.
Output
The output of the transformation is a single-band raster. Each pixel has a floating-point value in the range [0..1] measuring the density of the pixel relative to the rest of the surface. The raster can be styled using a <RasterSymbolizer>.
In order for the SLD to be correctly validated, the RasterSymbolizer <Geometry> element must be present to specify the name of the input geometry attribute (using <Geometry><ogc:PropertyName>...</ogc:PropertyName></Geometry>)
Example
The map image above shows a temperature surface interpolated across a set of data points with a attribute giving the maximum daily temperature on a given day. The surface layer in the image is produced by the following SLD. (The map image also shows the original input data points styled by another SLD, as well as a base map layer.) You can adapt this SLD to your own data by adjusting the transformation parameters, and by choosing a color map definition that provides an appropriate styling.
1 2 3 4 5 6 7 8 9 10 11 12 13 14 15 16 17 18 19 20 21 22 23 24 25 26 27 28 29 30 31 32 33 34 35 36 37 38 39 40 41 42 43 44 45 46 47 48 49 50 51 52 53 54 55 56 57 58 59 60 61 62 63 64 65 66 67 68 69 70 71 72 73 74 75 76 77 78 79 80 81 82 83 84 85 86 87 88 89 90 91 92 93 94 95 96 97 98 99 100 101 | <?xml version="1.0" encoding="ISO-8859-1"?>
<StyledLayerDescriptor version="1.0.0"
xsi:schemaLocation="http://www.opengis.net/sld StyledLayerDescriptor.xsd"
xmlns="http://www.opengis.net/sld"
xmlns:ogc="http://www.opengis.net/ogc"
xmlns:xlink="http://www.w3.org/1999/xlink"
xmlns:xsi="http://www.w3.org/2001/XMLSchema-instance">
<NamedLayer>
<Name>Barnes surface</Name>
<UserStyle>
<Title>Barnes Surface</Title>
<Abstract>A style that produces a Barnes surface using a rendering transformation</Abstract>
<FeatureTypeStyle>
<Transformation>
<ogc:Function name="gs:BarnesSurface">
<ogc:Function name="parameter">
<ogc:Literal>data</ogc:Literal>
</ogc:Function>
<ogc:Function name="parameter">
<ogc:Literal>valueAttr</ogc:Literal>
<ogc:Literal>value</ogc:Literal>
</ogc:Function>
<ogc:Function name="parameter">
<ogc:Literal>scale</ogc:Literal>
<ogc:Literal>15.0</ogc:Literal>
</ogc:Function>
<ogc:Function name="parameter">
<ogc:Literal>convergence</ogc:Literal>
<ogc:Literal>0.2</ogc:Literal>
</ogc:Function>
<ogc:Function name="parameter">
<ogc:Literal>passes</ogc:Literal>
<ogc:Literal>3</ogc:Literal>
</ogc:Function>
<ogc:Function name="parameter">
<ogc:Literal>minObservations</ogc:Literal>
<ogc:Literal>1</ogc:Literal>
</ogc:Function>
<ogc:Function name="parameter">
<ogc:Literal>maxObservationDistance</ogc:Literal>
<ogc:Literal>10</ogc:Literal>
</ogc:Function>
<ogc:Function name="parameter">
<ogc:Literal>pixelsPerCell</ogc:Literal>
<ogc:Literal>10</ogc:Literal>
</ogc:Function>
<ogc:Function name="parameter">
<ogc:Literal>queryBuffer</ogc:Literal>
<ogc:Literal>40</ogc:Literal>
</ogc:Function>
<ogc:Function name="parameter">
<ogc:Literal>outputBBOX</ogc:Literal>
<ogc:Function name="env">
<ogc:Literal>wms_bbox</ogc:Literal>
</ogc:Function>
</ogc:Function>
<ogc:Function name="parameter">
<ogc:Literal>outputWidth</ogc:Literal>
<ogc:Function name="env">
<ogc:Literal>wms_width</ogc:Literal>
</ogc:Function>
</ogc:Function>
<ogc:Function name="parameter">
<ogc:Literal>outputHeight</ogc:Literal>
<ogc:Function name="env">
<ogc:Literal>wms_height</ogc:Literal>
</ogc:Function>
</ogc:Function>
</ogc:Function>
</Transformation>
<Rule>
<RasterSymbolizer>
<!-- specify geometry attribute of input to pass validation -->
<Geometry><ogc:PropertyName>point</ogc:PropertyName></Geometry>
<Opacity>0.8</Opacity>
<ColorMap type="ramp" >
<ColorMapEntry color="#FFFFFF" quantity="-990" label="nodata" opacity="0"/>
<ColorMapEntry color="#2E4AC9" quantity="-9" label="nodata"/>
<ColorMapEntry color="#41A0FC" quantity="-6" label="values" />
<ColorMapEntry color="#58CCFB" quantity="-3" label="values" />
<ColorMapEntry color="#76F9FC" quantity="0" label="values" />
<ColorMapEntry color="#6AC597" quantity="3" label="values" />
<ColorMapEntry color="#479364" quantity="6" label="values" />
<ColorMapEntry color="#2E6000" quantity="9" label="values" />
<ColorMapEntry color="#579102" quantity="12" label="values" />
<ColorMapEntry color="#9AF20C" quantity="15" label="values" />
<ColorMapEntry color="#B7F318" quantity="18" label="values" />
<ColorMapEntry color="#DBF525" quantity="21" label="values" />
<ColorMapEntry color="#FAF833" quantity="24" label="values" />
<ColorMapEntry color="#F9C933" quantity="27" label="values" />
<ColorMapEntry color="#F19C33" quantity="30" label="values" />
<ColorMapEntry color="#ED7233" quantity="33" label="values" />
<ColorMapEntry color="#EA3F33" quantity="36" label="values" />
<ColorMapEntry color="#BB3026" quantity="999" label="values" />
</ColorMap>
</RasterSymbolizer>
</Rule>
</FeatureTypeStyle>
</UserStyle>
</NamedLayer>
</StyledLayerDescriptor>
|
In the SLD, Lines 15-71 define the Barnes surface rendering transformation, giving values for the transformation parameters which are appropriate for the input dataset. Line 18 specifies the input dataset parameter name. Line 22 specifies the name of the observation value attribute. Line 26 sets a length scale of 15 degrees. Line 30 sets the convergence factor to be 0.2. Line 33 requests that 3 passes be performed (one for the initial estimate, and two refinement passes). Line 38 specifies that the minimum number of observations required to support an estimated cell is 1 (which means every observation point will be represented in the output). Line 42 specifies the maximum distance from a computed grid cell to an observation point is 10 degrees. Line 46 defines the resolution of computation to be 10 pixels per cell, which provides efficient rendering time while still providing output of reasonable visual quality. Line 50 specifies the query buffer to be 40 degrees, which is chosen to be at least double the length scale for stability. Lines 52-69 define the output parameters, which are obtained from internal environment variables set during rendering, as described above.
Lines 73-98 define the symbolizer used to style the raster computed by the transformation. Line 75 defines the geometry property of the input dataset, which is required for SLD validation purposes. Line 76 specifies an overall opacity of 0.8 for the rendered layer. Lines 77-97 define a color map with which to symbolize the output raster. In this case the color map uses a type of ramp, which produces a smooth transition between colors. The type could also be intervals, which produces a contour effect with discrete transition between colors (as shown in the image below). Line 78 specifies that the NO_DATA value of -990 should be displayed with a fully transparent color of white (making uncomputed pixels invisible).
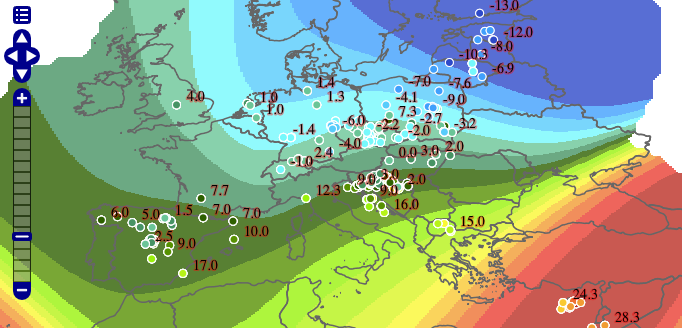
Barnes surface using intervals color map