Creating a dynamic contour map
The same contour map can be created dynamically with SLD and Rendering Transformations. The goal is to apply a style to the raster layer such that the contour lines are generated directly, without the need to create a separate vector layer.
Design
The data has already been loaded, so all that needs to be done is to craft a style for the raster layer that employs a rendering transformation. You can use the style created in the previous section here.
Adding a rendering transformation is done with the <Transformation> tag. The transformation name is gs:Contour, the name of the WPS process. From there, the other arguments to the process are supplied exactly as was done through the WPS Request Builder, except that no output format is required.
| Field | Value | Example |
|---|---|---|
| data | Name of the raster layer or the source of the data | opengeo:rainier |
| band | Name of the band used for the contour values | GRAY_INDEX |
| interval | Interval between contour lines | 100 |
| simplify | Whether to reduce the vertices in the output | true |
Add this to the SLD, and then apply the style directly to the raster layer.
        <Transformation>
          <ogc:Function name="gs:Contour">
            <ogc:Function name="parameter">
              <ogc:Literal>data</ogc:Literal>
            </ogc:Function>
            <ogc:Function name="parameter">
              <ogc:Literal>interval</ogc:Literal>
              <ogc:Literal>100</ogc:Literal>
            </ogc:Function>
            <ogc:Function name="parameter">
              <ogc:Literal>simplify</ogc:Literal>
              <ogc:Literal>true</ogc:Literal>
            </ogc:Function>
          </ogc:Function>
        </Transformation>
Here is the full SLD, including the rendering transformation:
<?xml version="1.0" encoding="ISO-8859-1"?>
<StyledLayerDescriptor version="1.0.0"
  xsi:schemaLocation="http://www.opengis.net/sld StyledLayerDescriptor.xsd"
  xmlns="http://www.opengis.net/sld"
  xmlns:ogc="http://www.opengis.net/ogc"
  xmlns:xlink="http://www.w3.org/1999/xlink"
  xmlns:xsi="http://www.w3.org/2001/XMLSchema-instance">
  <NamedLayer>
    <Name>contour_dem</Name>
    <UserStyle>
      <Title>Contour from DEM</Title>
      <Abstract>Extracts contours from DEM</Abstract>
      <FeatureTypeStyle>
        <Transformation>
          <ogc:Function name="gs:Contour">
            <ogc:Function name="parameter">
              <ogc:Literal>data</ogc:Literal>
            </ogc:Function>
            <ogc:Function name="parameter">
              <ogc:Literal>interval</ogc:Literal>
              <ogc:Literal>100</ogc:Literal>
            </ogc:Function>
            <ogc:Function name="parameter">
              <ogc:Literal>simplify</ogc:Literal>
              <ogc:Literal>true</ogc:Literal>
            </ogc:Function>
          </ogc:Function>
        </Transformation>
        <Rule>
          <Name>rule 1</Name>
          <Title>Contour Line (100)</Title>
          <MaxScaleDenominator>250000</MaxScaleDenominator>
          <LineSymbolizer>
            <Stroke>
              <CssParameter name="stroke">#662200</CssParameter>
              <CssParameter name="stroke-width">0.4</CssParameter>
            </Stroke>
          </LineSymbolizer>
        </Rule>
        <Rule>
          <Name>rule 2</Name>
          <Title>Contour Line (500)</Title>
          <ogc:Filter>
            <ogc:PropertyIsEqualTo>
              <ogc:Function name="IEEERemainder">
                <ogc:Function name="int2ddouble">
                <ogc:PropertyName>value</ogc:PropertyName>
                </ogc:Function>
                <ogc:Function name="parseDouble">
                  <ogc:Literal>500.0</ogc:Literal>
                </ogc:Function>
              </ogc:Function>
              <ogc:Literal>0</ogc:Literal>
            </ogc:PropertyIsEqualTo>
          </ogc:Filter>
          <LineSymbolizer>
            <Stroke>
              <CssParameter name="stroke">#662200</CssParameter>
              <CssParameter name="stroke-width">1</CssParameter>
            </Stroke>
          </LineSymbolizer>
        </Rule>
        <Rule>
          <Name>rule 3</Name>
          <Title>Label (100)</Title>
          <MaxScaleDenominator>250000</MaxScaleDenominator>
          <TextSymbolizer>
            <Label>
              <ogc:Function name="round">
                <ogc:PropertyName>value</ogc:PropertyName>
              </ogc:Function>
            </Label>
            <Font>
              <CssParameter name="font-family">Arial</CssParameter>
              <CssParameter name="font-weight">Normal</CssParameter>
              <CssParameter name="font-size">10</CssParameter>
            </Font>
            <LabelPlacement>
              <LinePlacement/>
            </LabelPlacement>
            <Halo>
              <Radius>
                <ogc:Literal>2</ogc:Literal>
              </Radius>
              <Fill>
                <CssParameter name="fill">#FFFFFF</CssParameter>
                <CssParameter name="fill-opacity">0.6</CssParameter>
              </Fill>
            </Halo>
            <Fill>
              <CssParameter name="fill">#662200</CssParameter>
            </Fill>
            <Priority>2000</Priority>
            <VendorOption name="followLine">true</VendorOption>
            <VendorOption name="repeat">300</VendorOption>
            <VendorOption name="maxDisplacement">50</VendorOption>
            <VendorOption name="maxAngleDelta">30</VendorOption>
            <VendorOption name="spaceAround">20</VendorOption>
          </TextSymbolizer>
        </Rule>
        <Rule>
          <Name>rule 4</Name>
          <Title>Label (500)</Title>
          <ogc:Filter>
            <ogc:PropertyIsEqualTo>
              <ogc:Function name="IEEERemainder">
                <ogc:Function name="int2ddouble">
                <ogc:PropertyName>value</ogc:PropertyName>
                </ogc:Function>
                <ogc:Function name="parseDouble">
                  <ogc:Literal>500.0</ogc:Literal>
                </ogc:Function>
              </ogc:Function>
              <ogc:Literal>0</ogc:Literal>
            </ogc:PropertyIsEqualTo>
          </ogc:Filter>
          <TextSymbolizer>
            <Label>
              <ogc:Function name="round">
                <ogc:PropertyName>value</ogc:PropertyName>
              </ogc:Function>
            </Label>
            <Font>
              <CssParameter name="font-family">Arial</CssParameter>
              <CssParameter name="font-weight">Bold</CssParameter>
              <CssParameter name="font-size">10</CssParameter>
            </Font>
            <LabelPlacement>
              <LinePlacement/>
            </LabelPlacement>
            <Halo>
              <Radius>
                <ogc:Literal>2</ogc:Literal>
              </Radius>
              <Fill>
                <CssParameter name="fill">#FFFFFF</CssParameter>
                <CssParameter name="fill-opacity">0.6</CssParameter>
              </Fill>
            </Halo>
            <Fill>
              <CssParameter name="fill">#662200</CssParameter>
            </Fill>
            <Priority>3000</Priority>
            <VendorOption name="followLine">true</VendorOption>
            <VendorOption name="repeat">300</VendorOption>
            <VendorOption name="maxDisplacement">50</VendorOption>
            <VendorOption name="maxAngleDelta">30</VendorOption>
            <VendorOption name="spaceAround">20</VendorOption>
          </TextSymbolizer>
        </Rule>
      </FeatureTypeStyle>
    </UserStyle>
  </NamedLayer>
</StyledLayerDescriptor>
Viewing
The process for applying this SLD is the same as in the previous section
Load the SLD into GeoServer via the Styles menu and selecting Add new style. Once that is done, associate this style with the original layer by going to the Layers menu, clicking on the layer name (the original raster layer this time), clicking on the Publishing tab, and selecting the style from the drop-down menu called Default style. Click Save when done.
Once these changes are saved, go to the Layer Preview and view the layer. You can also view the layer in GeoExplorer.
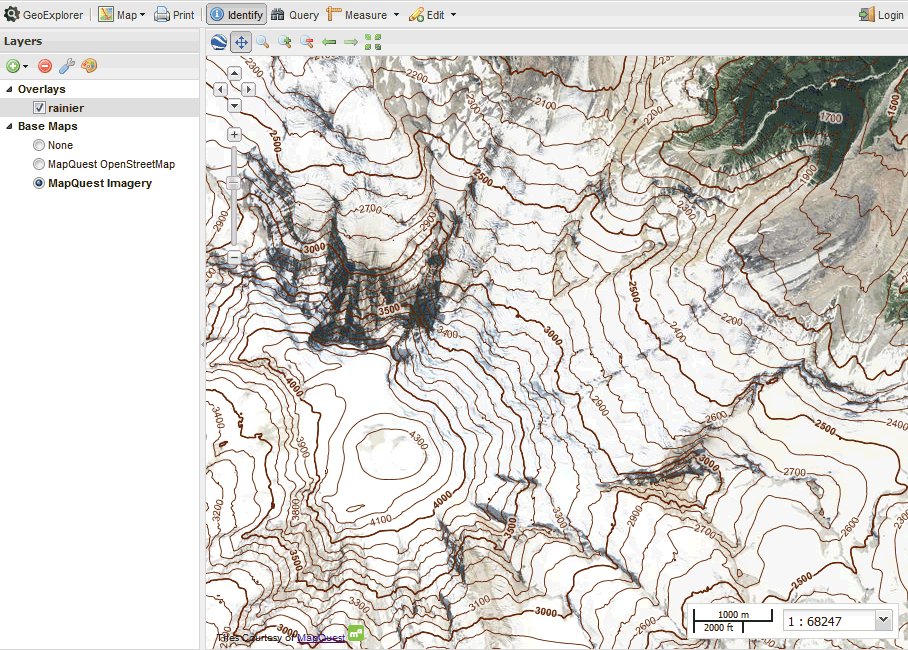
Dynamic contour map displayed in GeoExplorer
This map looks identical to the statically generated one. The advantage here is that a secondary vector layer was never created. This map is generated dynamically based on the source raster data, the built-in contour process, and styling.
Download the SLD used in this tutorial.